HLT-362V Week 5 Assignment 2 Summary and Descriptive Statistics
There is often the requirement to evaluate descriptive statistics for data within the organization or for health care information. Every year the National Cancer Institute collects and publishes data based on patient demographics. Understanding differences between the groups based upon the collected data often informs health care professionals towards research, treatment options, or patient education.
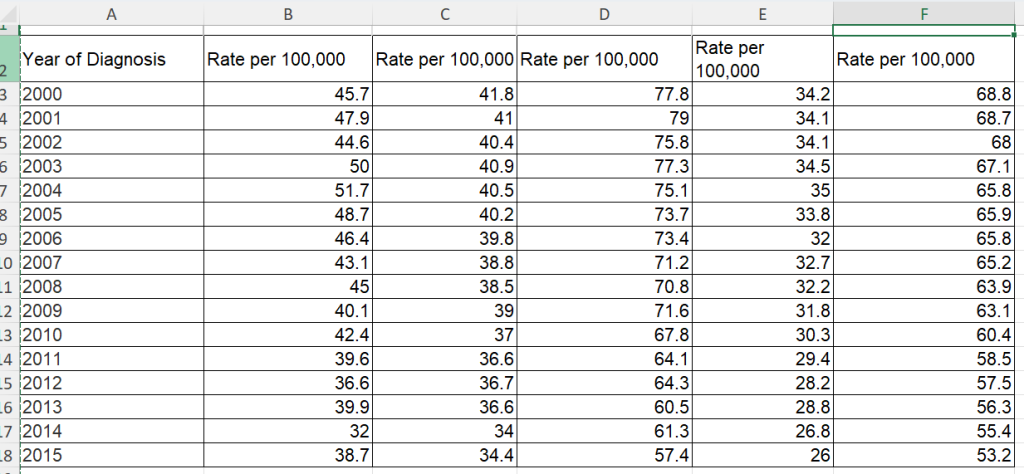
Using the data on the “National Cancer Institute Data” Excel spreadsheet, calculate the descriptive statistics indicated below for each of the Race/Ethnicity groups. Refer to your textbook and the topic Resources, as needed, for assistance in with creating Excel formulas.
Provide the following descriptive statistics:
- Measures of Central Tendency: Mean, Median, and Mode
- Measures of Variation: Variance, Standard Deviation, and Range (a formula is not needed for Range).
- Once the data is calculated, provide a 150-250 word analysis of the descriptive statistics on the spreadsheet. This should include differences and health outcomes between groups.
APA style is not required, but solid academic writing is expected.
This assignment uses a rubric. Please review the rubric prior to beginning the assignment to become familiar with the expectations for successful completion.
You are not required to submit this assignment to LopesWrite.
HLT-362V Week 5 Assignment 2 Summary and Descriptive Statistics Example
Descriptive Statistics Analysis
Healthcare statistical data is vital to decision-making and care delivery. Data helps in all preventive, curative, rehabilitative, and promotive health interventions. It helps understand the disease burden and is thus crucial in strategic planning. Data from the National Cancer Institute show variations in cancer prevalence across races.
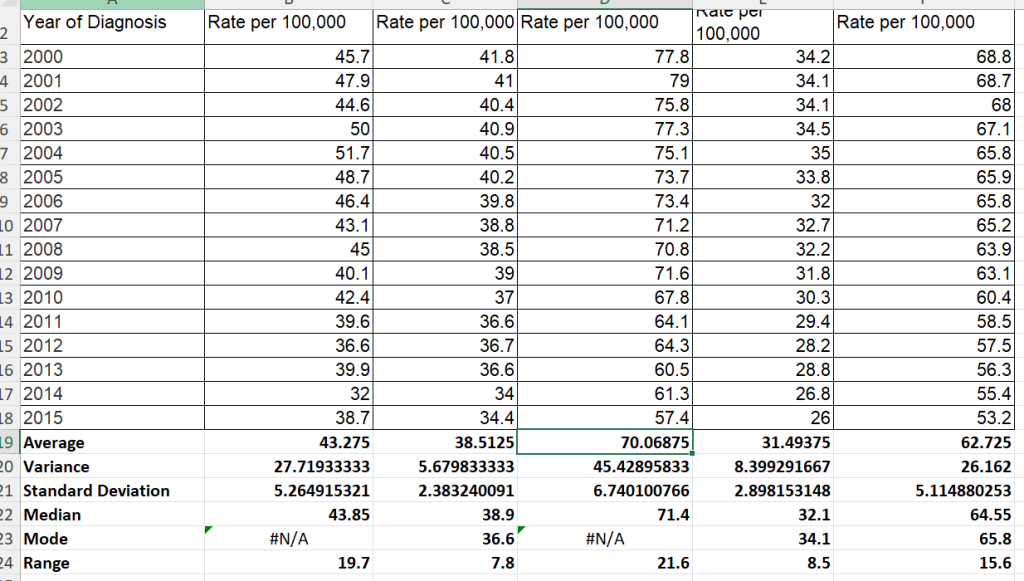
The mean prevalence of lung and bronchus cancer diagnosis from 2000-2015 for the American Indians/Alaska natives is 43.28, for Asians/Pacific Islanders, 38.51, for Blacks, 70.1, 31.49 for Hispanic Americans, and 62.73 for white Americans. The median prevalences for the five races are 43.85, 38.9, 71.4, 32.1, and 64.55, respectively. The groups’ variances are 27.72, 5.68, 45.43, 8.4, and 26.16, respectively. Blacks have the highest variance, meaning their cancer prevalence has significantly changed over the years. The groups’ standard deviations are 5.26, 2.38, 6.74, 2.9, and 5.11, respectively.
The Black Americans group has the highest mean, median, variance, and standard deviation, which shows that they have the poorest health outcomes because of the high prevalence of lung and bronchus cancer in the group. However, the cancer prevalence has drastically dropped over the years across all the groups, and the highest drop is in the Black group (from 77.8 in 2001 to 57.4 in 2015).
Hispanic Americans have the best health outcomes, with the lowest diagnosis/prevalence rate of lung and bronchus cancer compared to all other groups. The mean rate among this group is 31.49 per 100,000. Asian/Pacific Islanders follow Hispanics on the list, then Whites. These statistics will help develop preventative and health promotion programs/interventions to help prevent and manage lung and bronchus cancer. This task marks the end of this class. The next class is NRS-445: Nursing Research and Evidence Based Practice, which begins with NRS 445 Topic 1 Literature Evaluation Table.